

Author: Dr. Courtney Wheeler
lead author of Acadience Math
As a school psychologist who develops educational assessments and is a parent of a first-grade student currently attending school in a hybrid classroom setting, the impact of the COVID-19 pandemic on students’ learning is a constant thought in my head.
Questions have been popping up in my inbox lately about how COVID-19 has impacted performance on the Acadience Math assessment. I’ve been asked how schools have been prioritizing assessing students in math, what we’ve seen in our data system on how students are scoring this year as compared to last year, and if the results that we’ve been seeing differ from the trends that we’re seeing with reading. I’ve also had a few questions come in regarding where we go from here: How do we begin to plan for the future and address the varying gaps that students will have with their skills?
How have schools been prioritizing assessing students in math?
When we first started to look at our system-wide Acadience Math data, we knew from our experience with analyzing Acadience Reading K–6 data that there were going to be fewer schools giving the assessment between this year, 2020–2021, compared to last year, 2019–2020. Conducting assessment during a typical school year requires planning and resources. However, the added challenges of educating during the COVID-19 pandemic has also impacted how we assess students’ academic skills. Planning assessment when different modalities of learning are happening, plus needing to determine the best course of assessment administration (e.g., in person vs. remote), likely led to fewer students being assessed with Acadience Math. That being said, nearly 150,000 students across grades K–6 received the Acadience Math assessment at the beginning of 2020–2021, via in-person or remote administration. When we started looking at our data from this year and previous years, we decided to match the schools to ensure that we were looking at the same schools administering the assessment so that our sample of students was roughly similar. This led to a slightly reduced, but very healthy sample size in our analysis.
How are students scoring differently this year as compared to last year?
To examine the impact of the pandemic, we compared beginning-of-year scores from the current school year (2020–2021) to beginning-of-years scores from last year (2019–2020). This comparison allowed us to directly estimate the difference in math skills that the typical student experienced at the beginning of 2020–2021 compared to the beginning of 2019–2020. To account for potential differences between the students who received assessment this year compared to last year, we included students’ middle-of-year performance from the previous school year as a predictor. Middle-of-year performance was used instead of end-of-year performance due to how few students were assessed at the end of 2019–2020. Note that we weren’t able to examine the beginning of kindergarten because we used previous Acadience Math scores as a predictor, and we do not currently have math measures that are given before kindergarten.
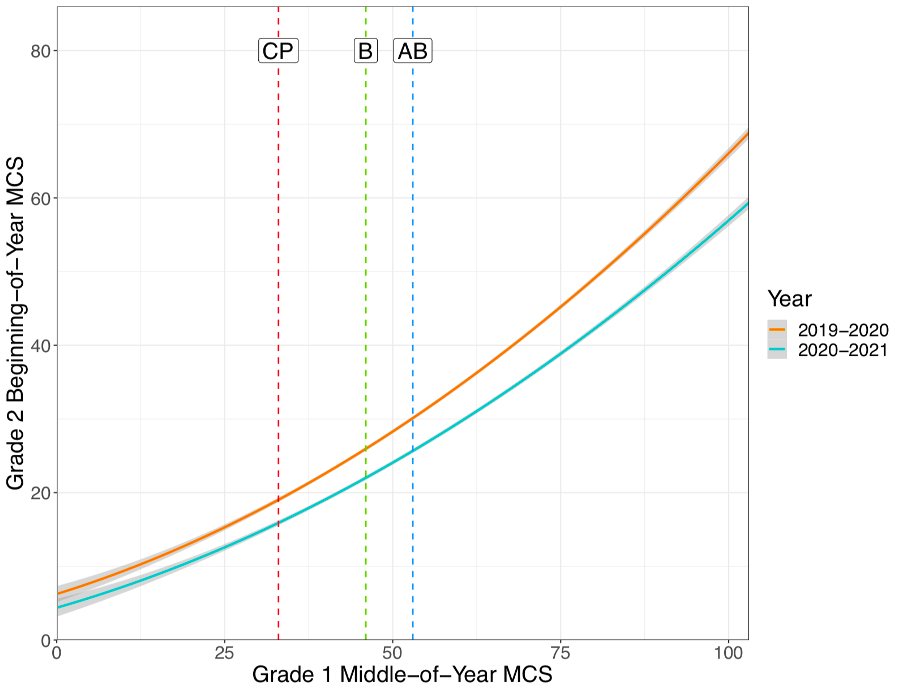
This graph shows the second-grade beginning-of-year Math Composite Score (MCS) as predicted by the middle-of-year MCS in first-grade, separated by the year in which students received their beginning-of-year benchmark assessment (2019–2020 or 2020–2021). The dashed vertical lines indicate the middle-of-year scores corresponding to the cut point for risk (CP), the benchmark (B), and the above benchmark (AB) level. A benchmark goal indicates a level of skill at which the student is likely to achieve the next Acadience Math benchmark goal or math outcome and the cut point for risk indicates a level of skill below which the student is unlikely to achieve subsequent math goals without receiving additional, targeted instructional support.
The gap between the two curved lines indicates the difference in student performance on the MCS at the beginning of 2020–2021 (turquoise line) compared to the beginning of 2019–2020 (orange line). A larger gap indicates a greater difference between scores and a larger impact of the pandemic on math skills. In the graph above, we can see that the gap between the lines widens, meaning that the effect of the pandemic was different based on students’ initial level of skills. The effect is greatest at the high end of the performance spectrum and smallest at the low end. This is just a glimpse for one grade of how different student performance was between the beginning of 2019–2020 and 2020–2021.
We can also look at how the pandemic has impacted students’ likelihood of meeting later benchmarks. For students with scores At or Above Benchmark, the overall likelihood of achieving subsequent math benchmarks is approximately 80% to 90%. These students are likely to need effective core instruction to meet subsequent math outcomes. Within this range, the likelihood of achieving subsequent goals is lower for students whose scores are right at the benchmark and increases as scores increase above the benchmark. Between the benchmark and cut point for risk is a range of scores where students’ future performance is more difficult to predict. For students with scores in the Below Benchmark range, the overall likelihood of achieving subsequent math benchmarks is approximately 40% to 60%. These students are likely to need strategic support to ensure their achievement of future benchmarks. For students who score below the cut point for risk or in the Well Below range, the overall likelihood of achieving subsequent math benchmarks is low, approximately 10% to 20%. These students are identified as likely to need intensive support.
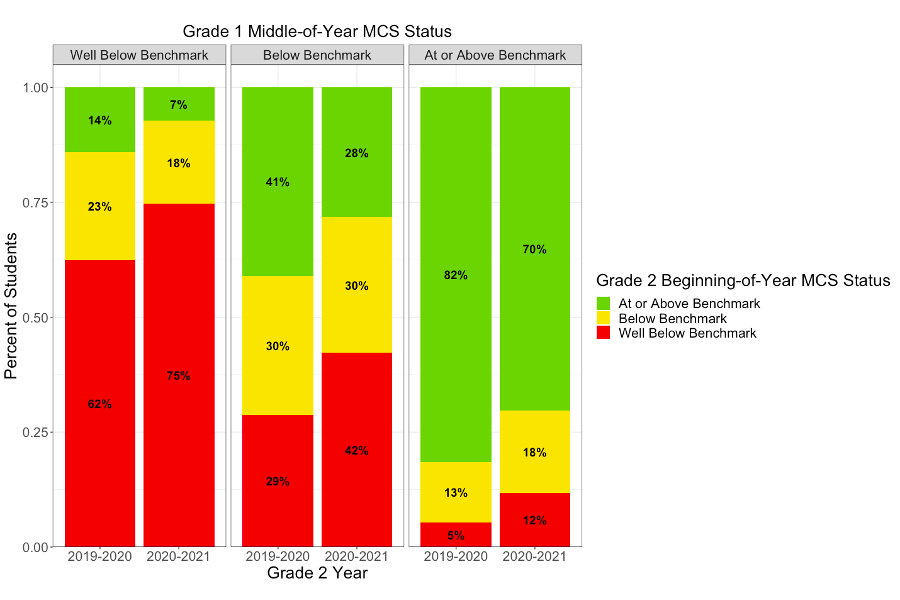
The bar graph above represents the percent of students in each benchmark category at the beginning of second grade on the MCS based on their middle-of-year first-grade benchmark status and the year in which they received beginning-of-year benchmark assessment (2019–2020 or 2020–2021). Looking at the bar graph, we can see that students entering second grade in 2020–2021 were less likely to meet the MCS benchmark. We can see that of the students who were At or Above Benchmark at the middle of first grade in 2018–2019, 82% were also At or Above Benchmark at the beginning of second grade. For first grade students who were At or Above Benchmark at the middle of 2019–2020, the percentage who met the benchmark at the beginning of first grade in 2020–2021 dropped to just 70%. This represents a 12% decline in students meeting later math benchmarks from first to second grade.
We observed these trends in beginning-of-year performance on the Acadience Math assessment across grades 1–6. Our findings were different than what we saw with Acadience Reading, in which the larger impacts of COVID-19 were seen in the earlier grades.
How can we close the gap?
We know that gaps in skills will exist when students start the 2021–2022 school year. Gaps in skills existed prior to the pandemic as well, but now we are faced with addressing those academic gaps on an unprecedented scale. However, the method in which we recommend tackling gaps remains the same. Using a systematic approach, like the Outcomes-Driven Model, and armed with data from a reliable and valid assessment, like Acadience Math, we can analyze the data we are collecting both at a systems level and at the student level to develop a plan for addressing those gaps. Once the gaps are identified, it will be important to use evidence-based practices to help teachers and educators meet the needs of their students.
Join us:
Join me and Acadience Learning Research Analyst Amy Warnock at our webinar on March 24th as we discuss our findings in more depth and talk about implications for the future. A technical brief with the full results from our research will also be posted to our website.